Building permits in San Francisco, August 2026
housing
economy
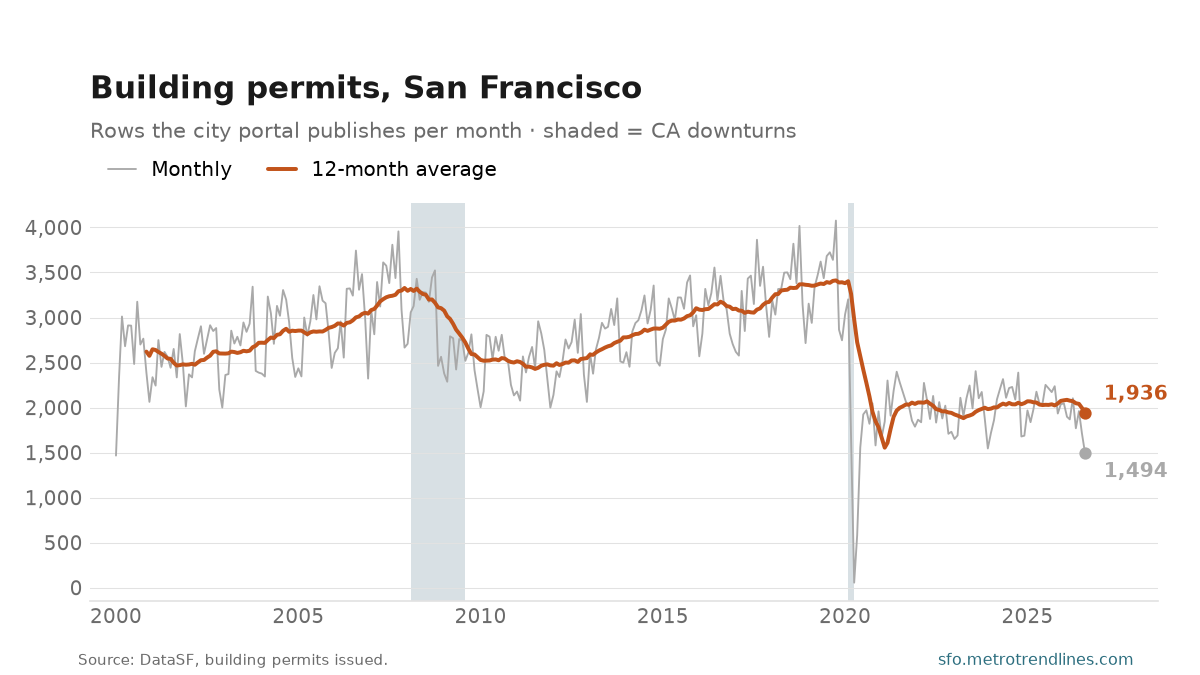
San Francisco’s open-data portal lists 1,494 building permits issued for August 2026, down 32.5% on a year earlier. The 12-month average is 1,936 a month.
A permit is permission to build, not a building: some are never used, and one large project can weigh more than a hundred small ones. The count includes every size of job the city permits, from a repair to a tower.
The heavier line is the 12-month average, which takes out the seasonal swing; compare a month with the same month a year earlier rather than with the month before. The newest month is left out until it is complete.
Source: DataSF, building permits issued, counted by month. Auto-generated each build.