San Francisco’s home market, August 2026
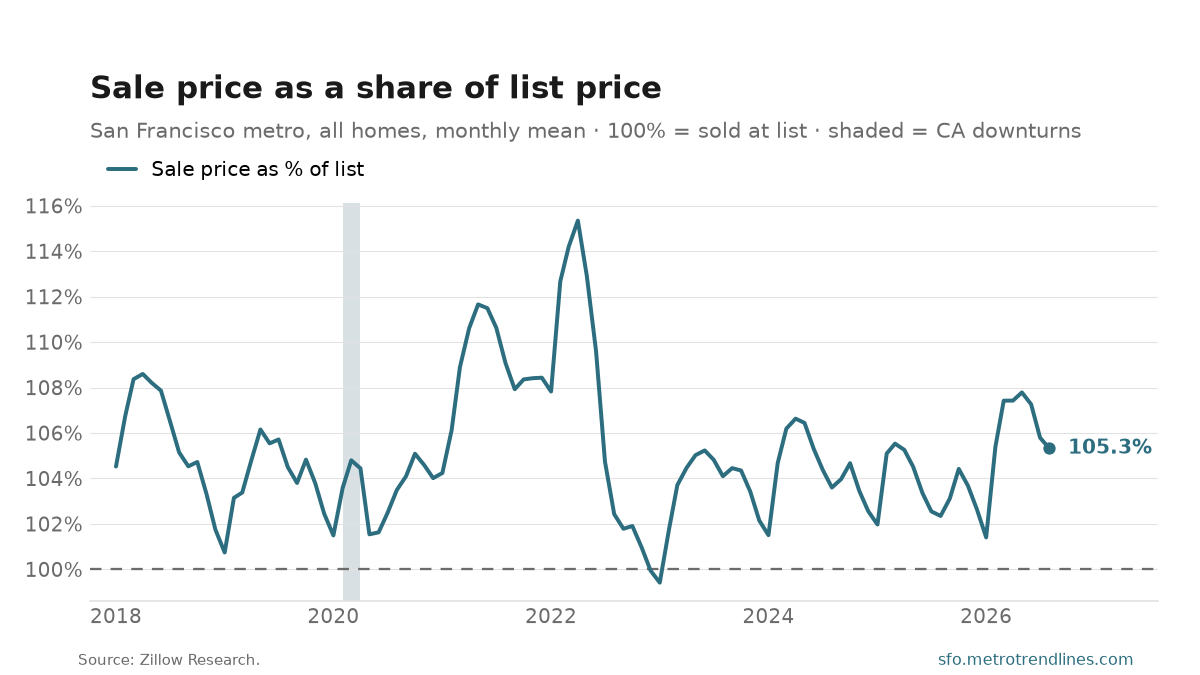
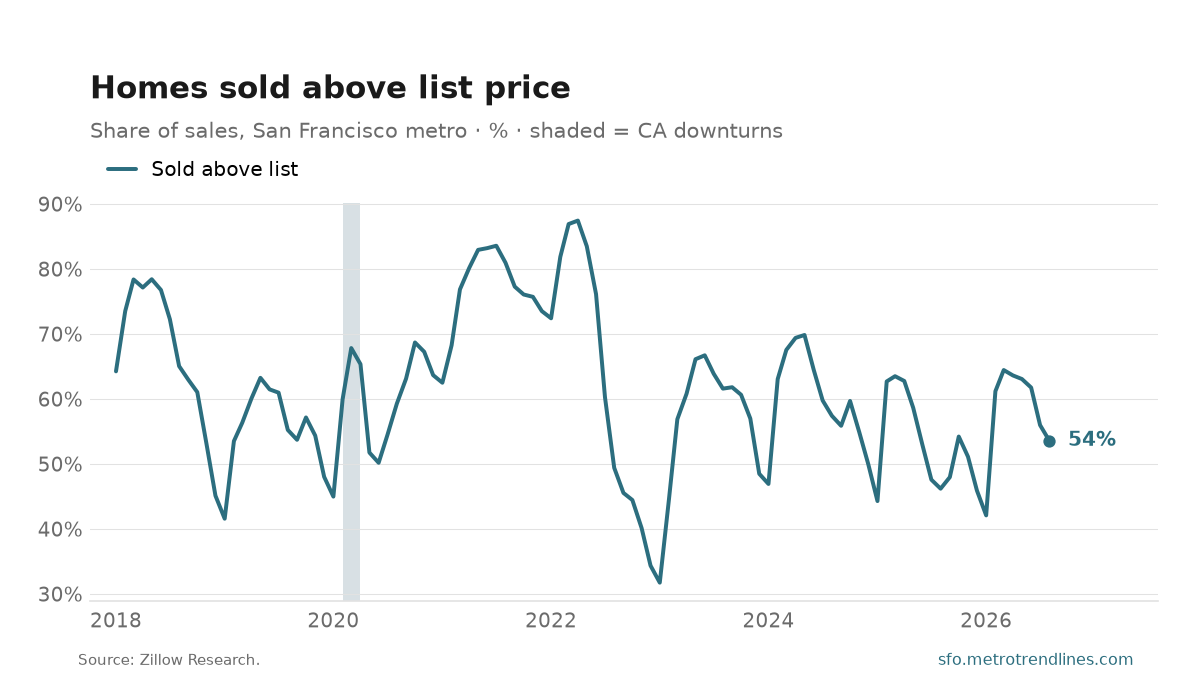
Homes in the San Francisco metro sold for 105.3% of their list price on average in August 2026, against 102.4% a year earlier, and 54% of them sold above it. The most competitive month in this record was April 2022, at 115.3% of list.
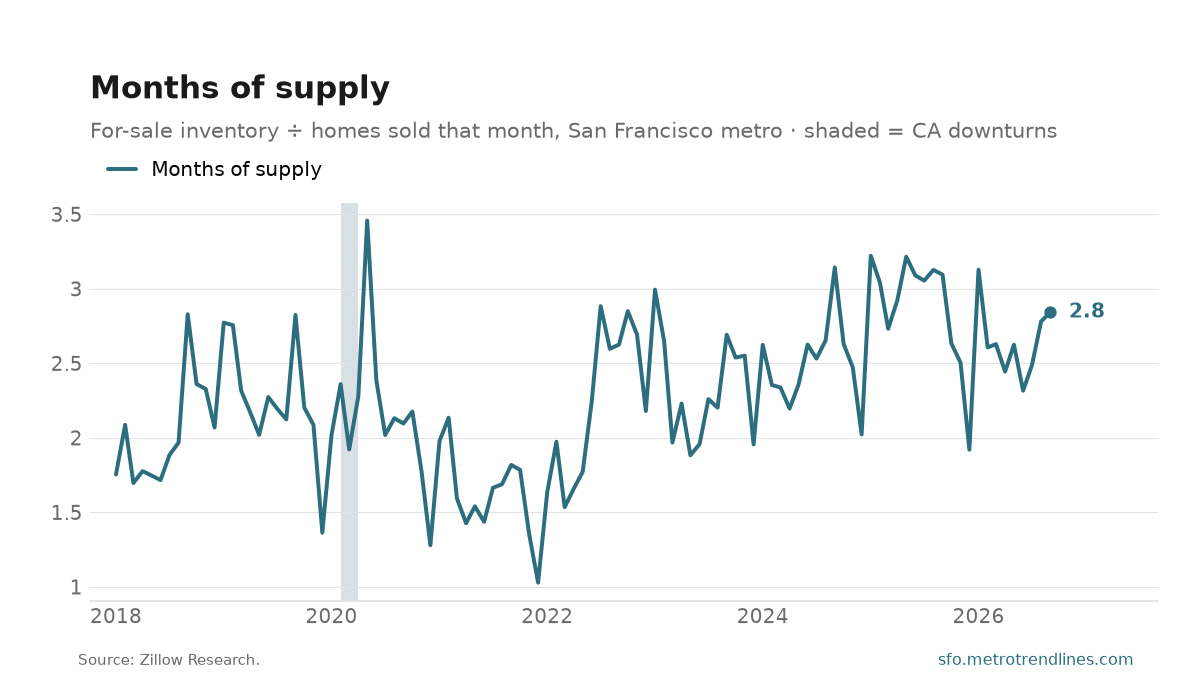
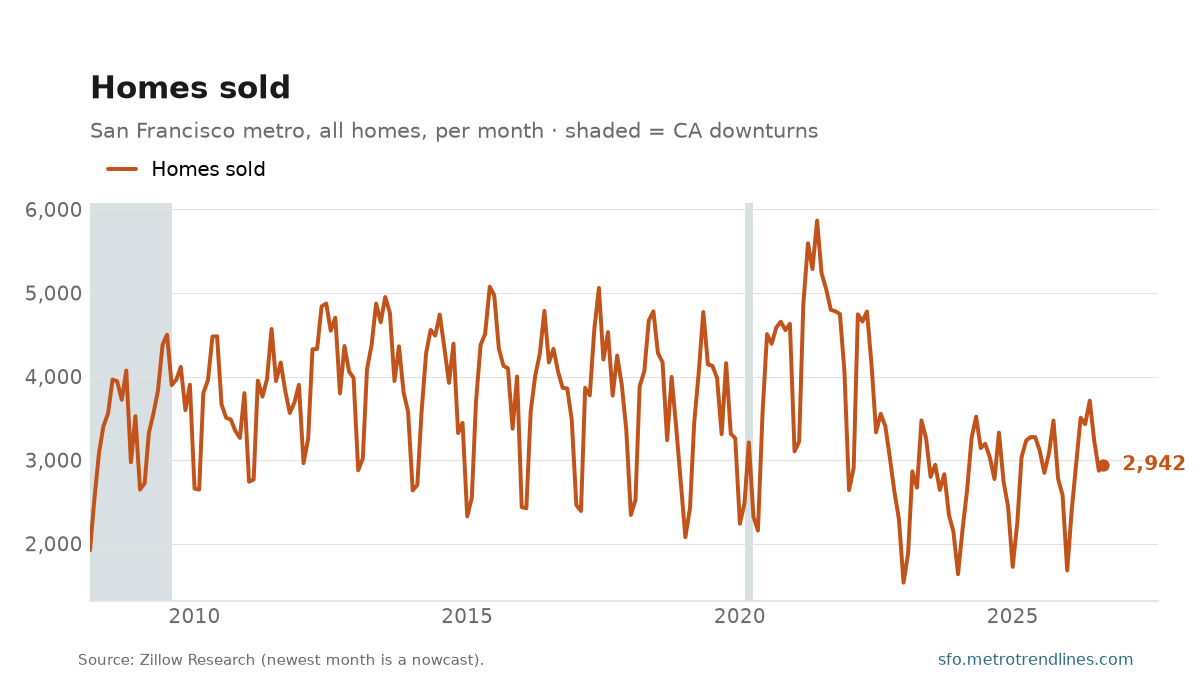
At September 2026’s pace of sales, the homes for sale would last 2.8 months — months of supply, for-sale inventory over a month’s sales. Under about four months is a market where sellers set the terms; six or more is one where buyers do. 2,942 homes sold in September 2026, against 3,082 a year earlier.
Every one of these has a season — spring is the bidding season — so compare a month with the same month a year earlier. These are Zillow’s figures for the San Francisco-Oakland-Fremont metro, all homes, not seasonally adjusted; the newest month of sales is Zillow’s nowcast and firms up later. There is no median price here, on purpose: a median moves with which homes happen to sell, so a month heavy in condos reads as a fall in prices that did not happen.
Source: Zillow Research, metro data for San Francisco-Oakland-Fremont, all homes; months of supply is inventory over sales. Auto-generated each build.