San Francisco-metro construction jobs, September 2026
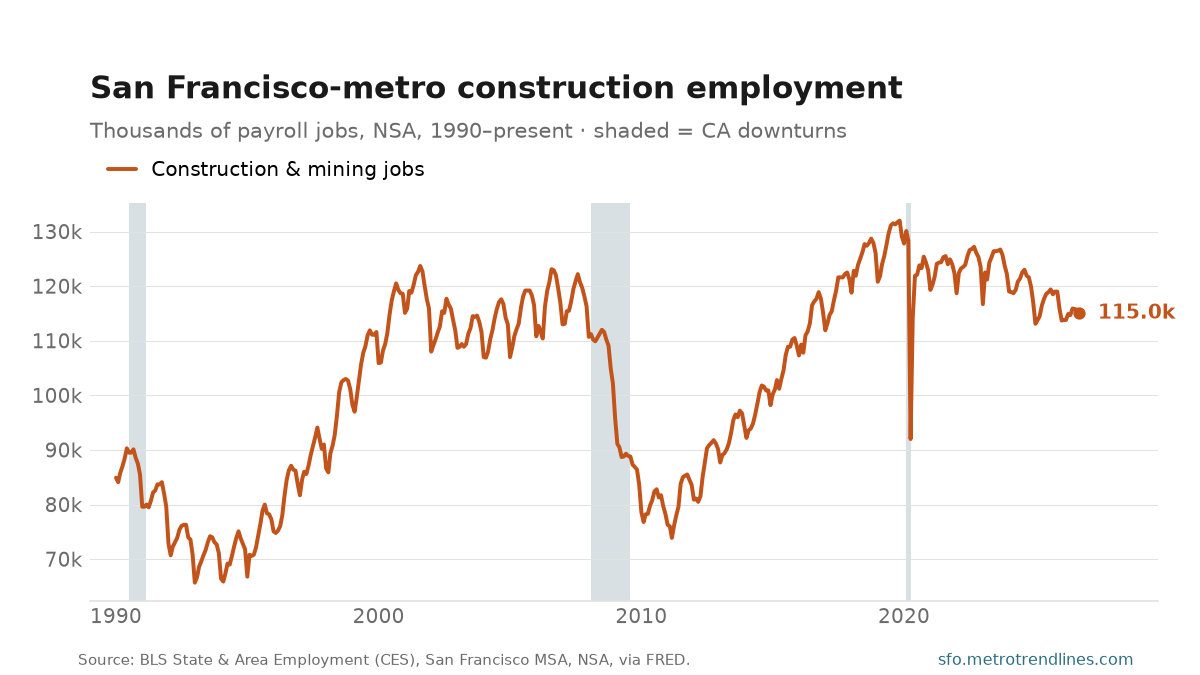
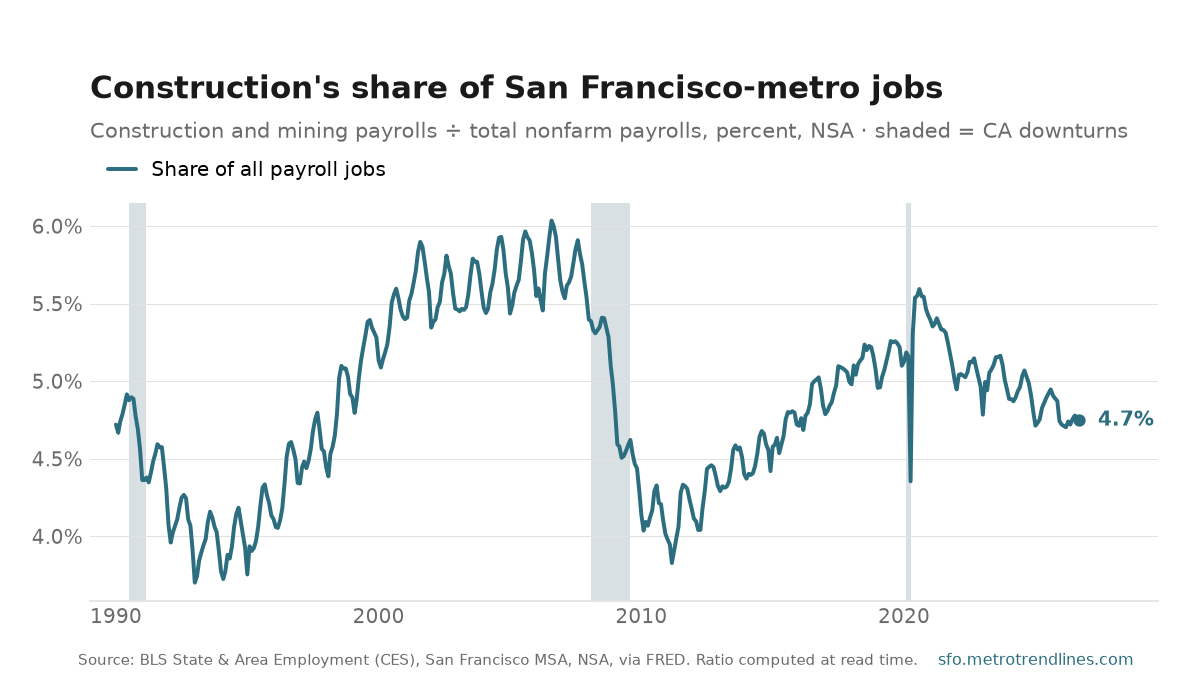
The San Francisco metro’s construction and mining employers had 115,000 jobs on payroll in September 2026, down 3.0% from a year earlier. That is 4.7% of all payroll jobs in the metro, against 4.9% a year before.
Construction is the most cyclical sector the site tracks and the one that turns first. The share chart shows it without the flattery of a growing economy — it peaked at 6.0% in August 2006 and bottomed at 3.7% in January 1993, a measure of how much of the region’s labour is pointed at building anything.
It has a real summer season in the raw data, so — as everywhere in these NSA series — the year-over-year change is the number that means something and a fall from August to January is just weather. It sits alongside building permits as this site’s two reads on whether San Francisco is building: permits lead; payrolls are what actually happened. The share is computed at read time from the same BLS release as the count.
Source: U.S. Bureau of Labor Statistics, State & Area Employment, mining, logging and construction and total nonfarm payrolls, San Francisco–Oakland–Fremont MSA, not seasonally adjusted, via FRED. The share is derived at read time. Auto-generated each build.