San Francisco-metro finance jobs, September 2026
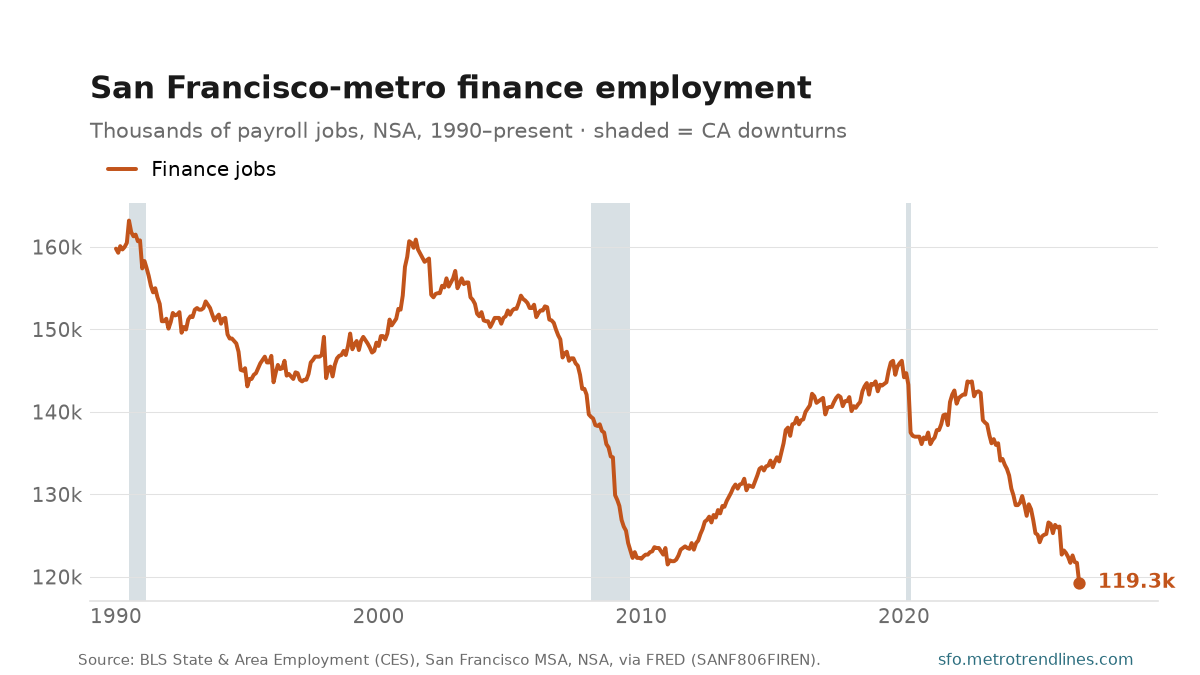
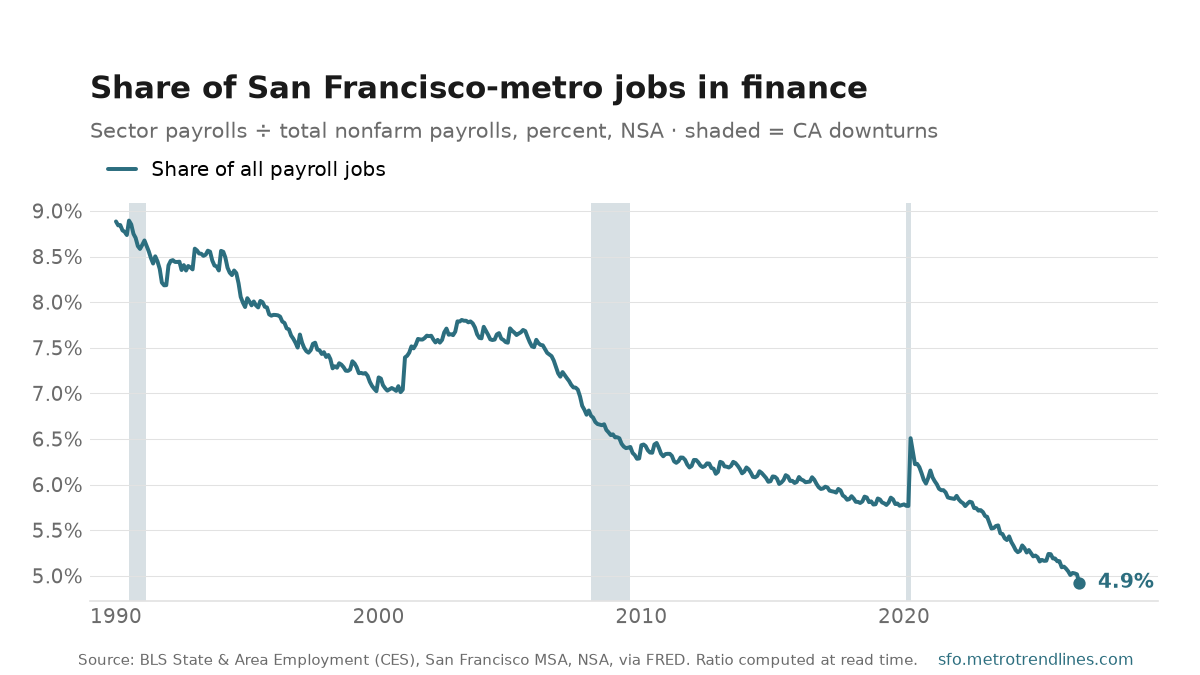
San Francisco-metro financial activities employers had 119,300 people on payroll in September 2026, down 4.8% from a year earlier. That is 4.9% of all payroll jobs in the metro, against 5.2% a year before.
Finance and insurance plus real estate, rental and leasing — banks, insurers, mortgage lenders, brokers and property managers. Real estate and lending also make it sensitive to interest rates in a way most sectors are not.
The two charts answer different questions. The count peaked at 163,200 in July 1990 and says whether the sector is hiring. The share — from 8.9% in January 1990, with a high of 8.9% in July 1990 and a low of 4.9% in September 2026 — says whether it is growing faster or slower than the rest of the economy.
Not seasonally adjusted, so compare a month with the same month a year earlier. The share is computed at read time from two series in the same BLS release, so it stays consistent when the levels are revised.
Source: U.S. Bureau of Labor Statistics, State & Area Employment, financial activities and total nonfarm payrolls, San Francisco–Oakland–Fremont MSA, not seasonally adjusted, via FRED (SANF806FIREN, SANF806NAN). The share is derived at read time. Auto-generated each build.