San Francisco-metro government jobs, September 2026
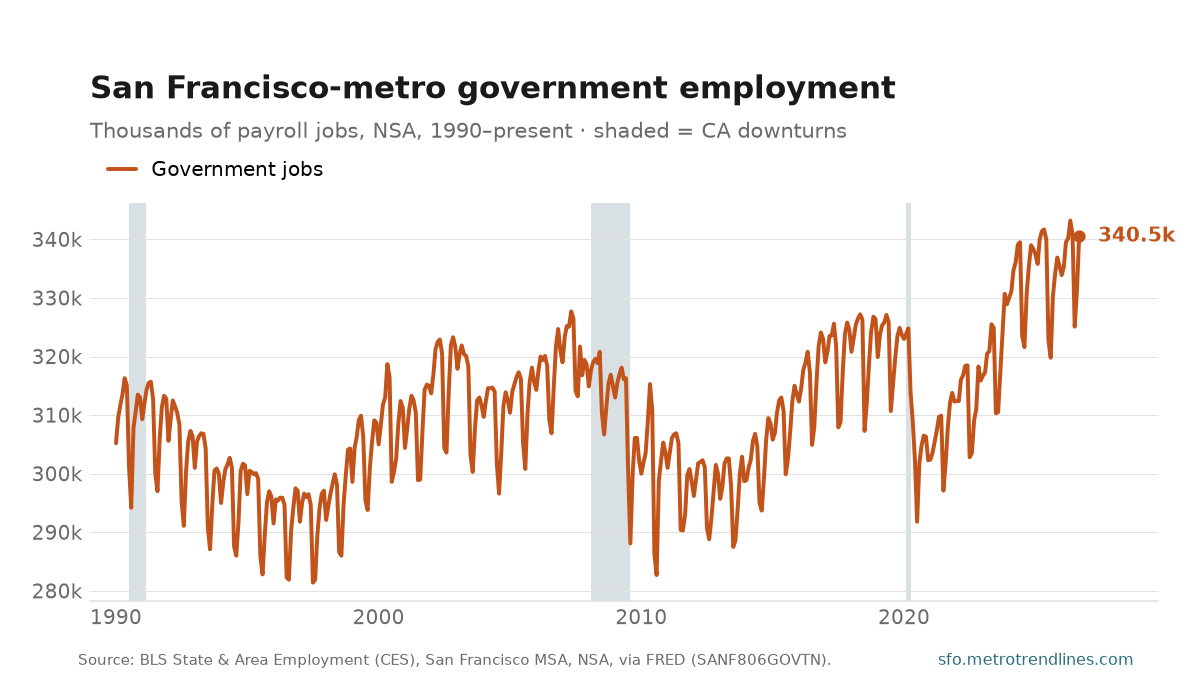
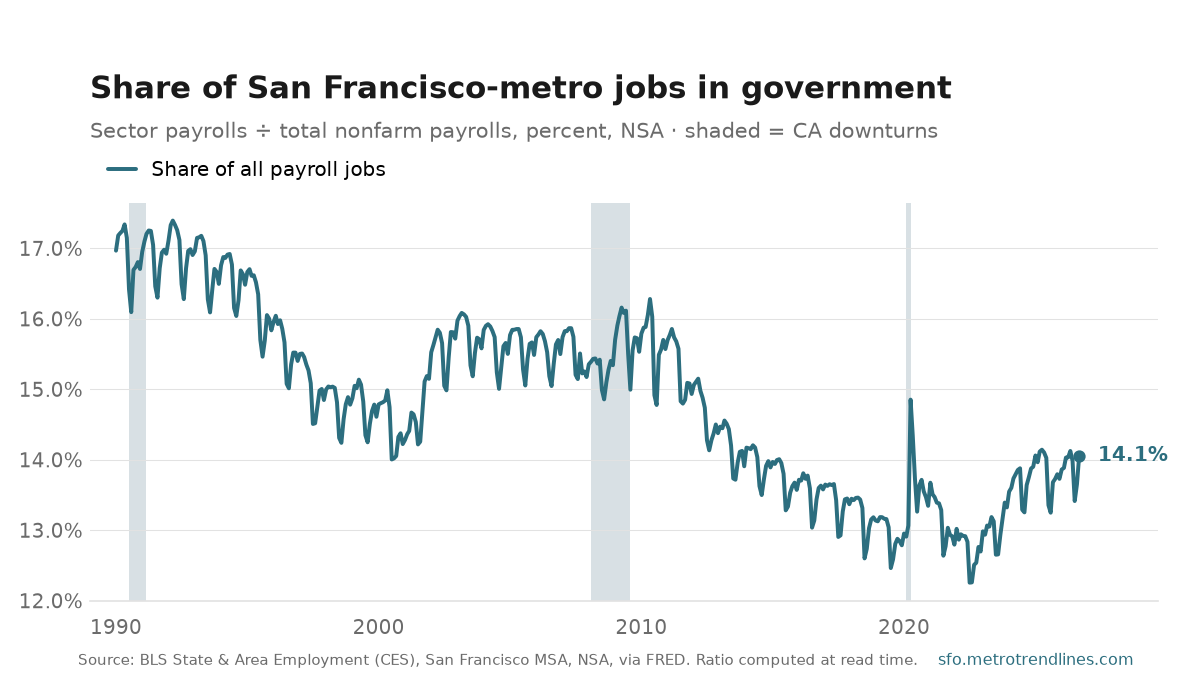
San Francisco-metro government employers had 340,500 people on payroll in September 2026, up 3.1% from a year earlier. That is 14.1% of all payroll jobs in the metro, against 13.7% a year before.
Federal, state and local government, including public schools, the University of California, public hospitals and the Postal Service — and, because BLS counts them as local government, tribal enterprises such as casinos. Government hiring follows tax revenue with a lag, which is why its share tends to rise in a recession: the private sector cuts first. The deep sawtooth in both lines is the school year — public-school staff come off the payroll count every summer — so this series above all needs the year-over-year comparison.
The two charts answer different questions. The count peaked at 343,200 in May 2026 and says whether the sector is hiring. The share — from 17.0% in January 1990, with a high of 17.4% in March 1992 and a low of 12.3% in July 2022 — says whether it is growing faster or slower than the rest of the economy.
Not seasonally adjusted, so compare a month with the same month a year earlier. The share is computed at read time from two series in the same BLS release, so it stays consistent when the levels are revised.
Source: U.S. Bureau of Labor Statistics, State & Area Employment, government and total nonfarm payrolls, San Francisco–Oakland–Fremont MSA, not seasonally adjusted, via FRED (SANF806GOVTN, SANF806NAN). The share is derived at read time. Auto-generated each build.