San Francisco building permits, September 2026
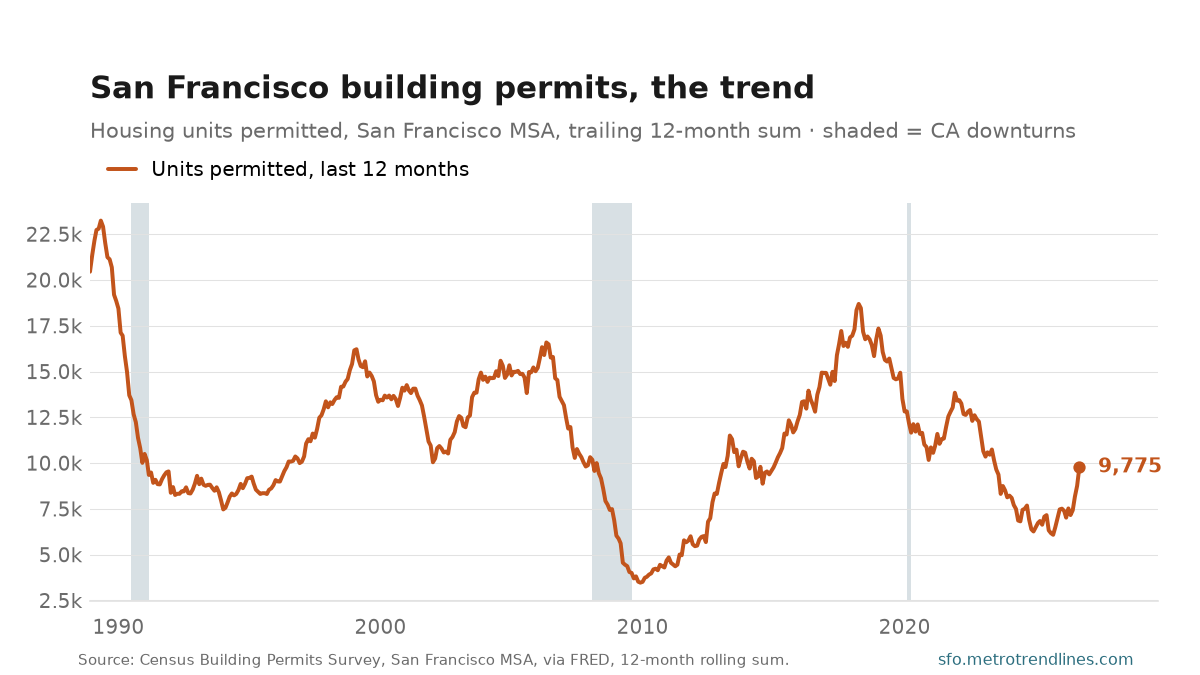
The San Francisco metro permitted 9,775 housing units in the twelve months through September 2026, up 60.6% from the twelve months before. The twelve-month total peaked at 23,242 in May 1989 and bottomed at 3,474 in December 2009.
The first chart is the trend. A twelve-month sum holds a whole year of filings, so one large building cannot move it much and the seasons cancel out. It is the line to read for whether San Francisco is permitting more housing or less.
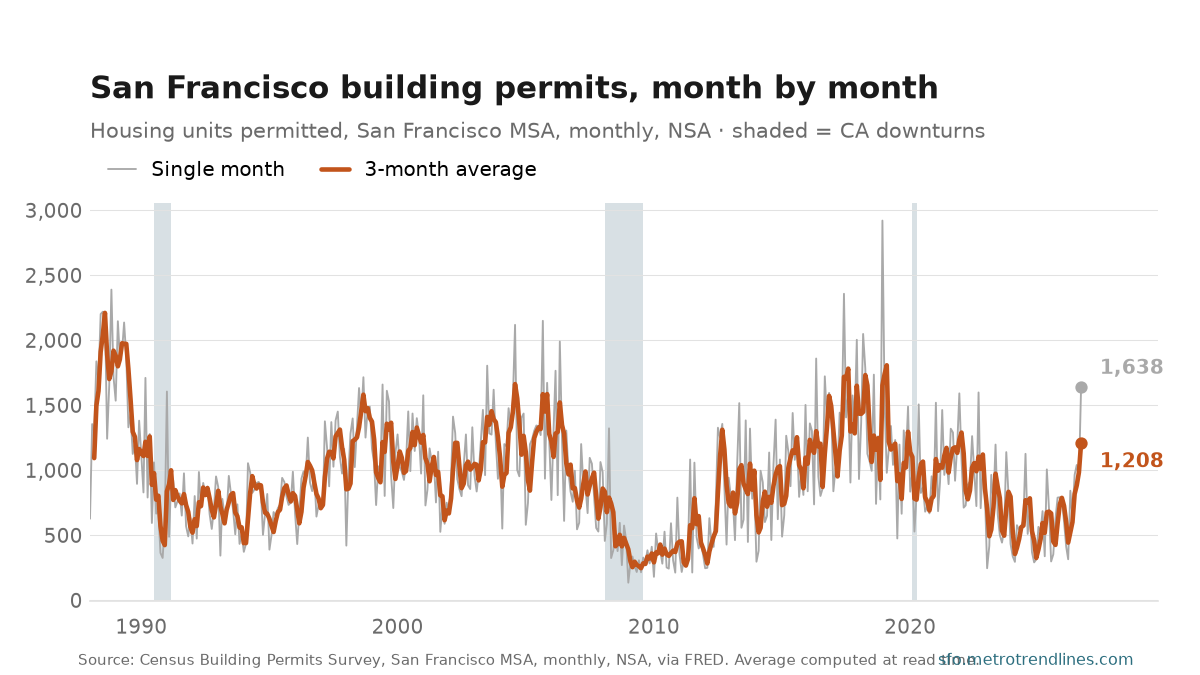
The second chart is the same data one month at a time, and it shows why the first one exists. In September 2026 alone the metro permitted 1,638 units — the light grey line — which is worth about 17% of the year. One apartment building can be several hundred units filed on one day, so the raw count swings between 136 and 2,921 without the industry doing anything unusual; every ‘permits plunge’ story is built on that line alone. The orange line is a three-month average — 1,208 a month, up 183.3% on a year earlier — which turns within a season and still takes out most of the single-filing noise.
Permits lead construction: they say what builders intend, and the monthly construction jobs post says what they did. Not seasonally adjusted — permits have a spring — so compare with the same months a year earlier.
Source: U.S. Census Bureau Building Permits Survey, San Francisco–Oakland–Fremont MSA, monthly, not seasonally adjusted, via FRED (SANF806BPPRIV). The twelve-month sum and three-month average are computed from the monthly count. Auto-generated each build.